14 December 2025

This article is part of the Signals over Noise newsletter also accessible on LinkedIn.
Prologue
The report landed on my desk the first month into my tenure at McKinsey in 2012.
It was thick—hundreds of pages—the product of a several-month internal initiative completed before I'd joined. A dozen senior partners and associates had built an elaborate model predicting the adoption of electric powertrains across global markets, mapping ripple effects through the industry. The kind of proprietary analysis we'd leverage in pitch meetings, splashy publications, client presentations. The kind that justified McKinsey fees.
The numbers were bold. Transformative, even.
They were also wrong.
By year's end, the gap between forecast and reality had widened to a chasm. The following year, our team quietly agreed we'd need to warn anyone wanting to use the report: the forecast had collapsed. McKinsey wasn't alone—third-party data providers had published similarly rosy projections, and they too were quietly walking back their predictions. The technology was simply too volatile, the variables too unpredictable. Every major firm was making the same decision: abandon EV forecasting entirely. Stick to historical data. Play it safe.
Until...
Return of the Forecast
A few years passed.
Something shifted. Tesla launched the Model 3. Battery prices dropped. Energy density improved. In a few countries like China and Norway, EVs have become more common.
The data was starting to tell a story.
Patterns emerged. Adoption curves that looked familiar, predictable even. The chaos of the early 2010s was giving way to something clearer, something we could model. The market was finding its rhythm. Consultants love patterns. Clients pay for perceived certainty. And after years of playing it safe, the temptation to forecast again became more irresistible.
This time, some convinced themselves, it would be different. What could possibly go wrong?
The Market Strikes Back
So, the industry returned to forecasting EV sales. The models were updated, the assumptions tweaked. And the results?
Exhibit A: The 'Tipping Point' That Arrived Ahead of Schedule
In January 2020, BCG published an article titled "Who Will Drive Electric Cars to the Tipping Point?". Their powertrain model projected that global BEV sales would reach 4% market share in 2022—essentially doubling from 2019 levels.
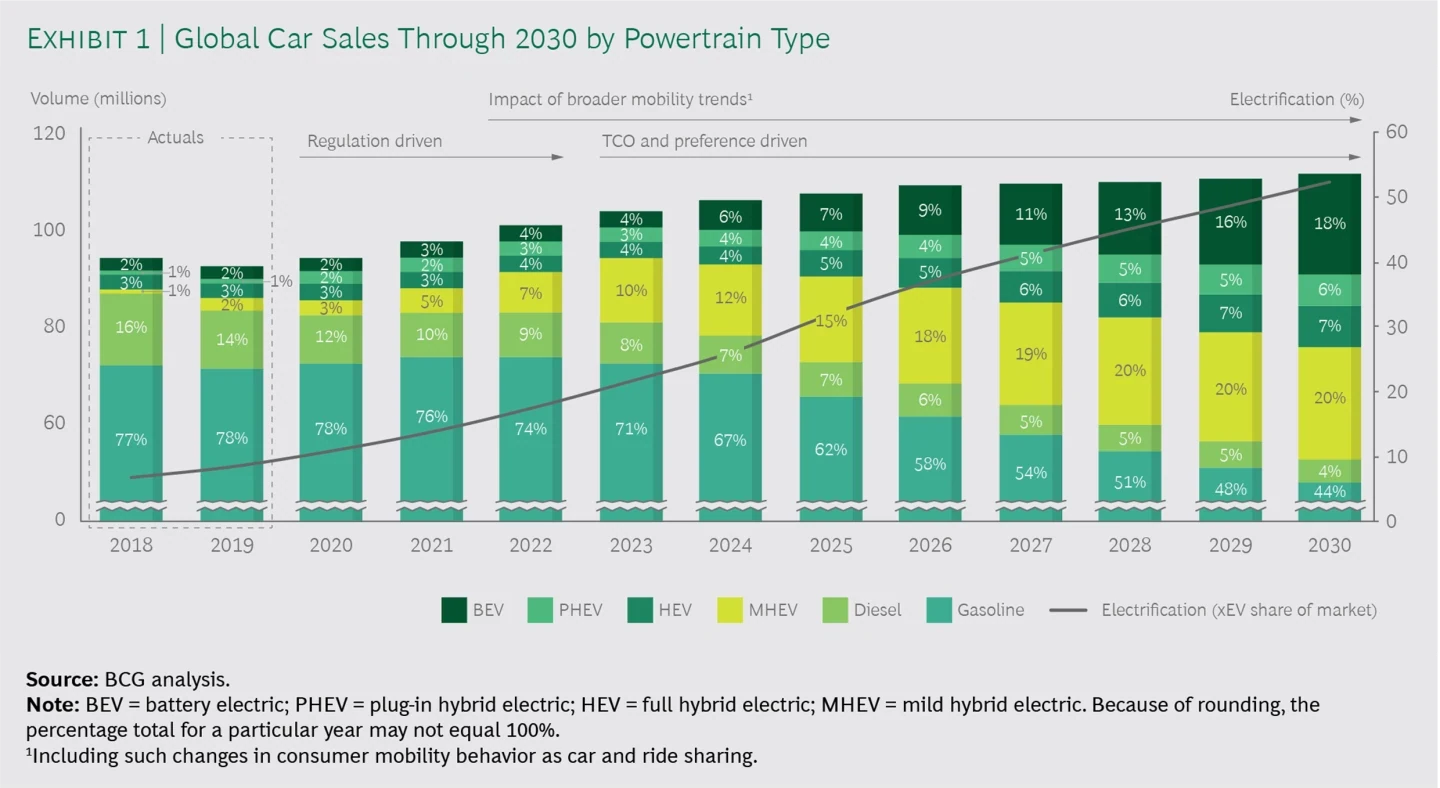
The reality? The actual figure in 2022 hit 10%.
They didn't just miss the target; they missed the magnitude of the wave. The market moved 2.5x faster than one of the world's leading management consulting firms believed was possible.
Similarly, in September 2020, McKinsey published "Electric mobility after the crisis: Why an auto slowdown won’t hurt EV demand". In it, for China, McKinsey forecasted the growth of EVs (BEVs + PHEVs) from 1.2 million units sold in 2019 to between 2.4 million units (low case) and 3.5 million units (high case) in 2022.
The actual number of units sold in China in 2022: 6.9 million (i.e. nearly double the number from their high case).
Exhibit B: Rearview Mirror Syndrome
Arguably, a bigger problem lies with external data vendors. Unlike consulting firms, where forecasts like those mentioned above are often for publicity and to "start discussion", these vendors' entire business model is based on selling "data" which feeds into the planning and business development departments of OEMs and suppliers.
Yet, their methodology often reveals a fatal flaw: Rearview Mirror Syndrome.
These forecasts frequently amount to simple extrapolations of last year’s numbers with a polite upward tweak. They look tidy in a chart, but they collapse in unstable markets because they assume the future will behave exactly like the past.
Below is a snapshot from an LMC Automotive (now GlobalData) presentation in June 2019, forecasting powertrain mix in ASEAN.
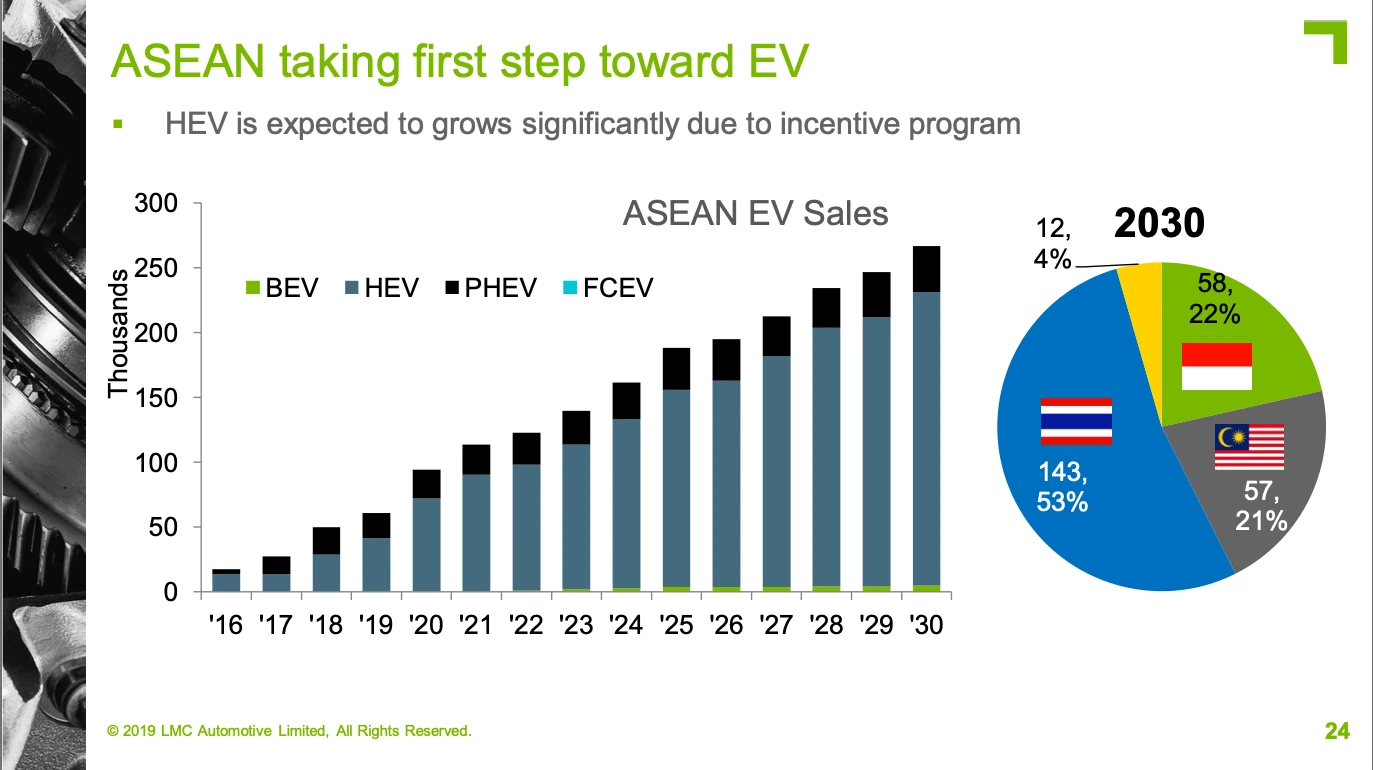
Source: LMC Automotive
Look closely at 2030. Even 10+ years ahead, you can barely see any BEVs. The bars are dominated by HEVs, followed by PHEVs.
In reality, by 2025—five years before that forecast ends—BEV adoption in key ASEAN markets has exploded to above 200,000 units sold in 2025. The gap between this forecast and the 2025 reality isn't just a margin of error; it is so huge that it's visible from space.
Exhibit C: Zooming into Chaos
If the macro numbers (Global) and the regional numbers (ASEAN) are wrong, maybe the more granular data such as the specific OEM forecasts is better? After all, this is the expensive data used to pick winners and losers.
Unfortunately, the error is fractal: the closer you zoom in, the uglier it gets.
If your top-line assumptions are flawed, your granular assumption data is destined to be a hallucination. Take LMC Automotive’s March 2022 forecast for BYD. They predicted BYD’s global sales would reach 1.22 million units in 2025, as quoted by Marklines.
As of today, BYD is on track to sell almost 5 million units in 2025. The difference is more than the entire car market in Germany!
The Phantom Stability
Despite the continued failure of previous forecasts, the industry hasn't kicked the habit. Let's briefly look at some recent examples.
Some of them, like the example below from BCG (based on S&P Global data), illustrate what I call The Stabilization Myth. Looking at the historical line, you see Chinese challengers growing at a ferocious 50%+ per year. But look at the forecast (indicated with "E" next to the year): it immediately eases into a moderate, polite growth rate.
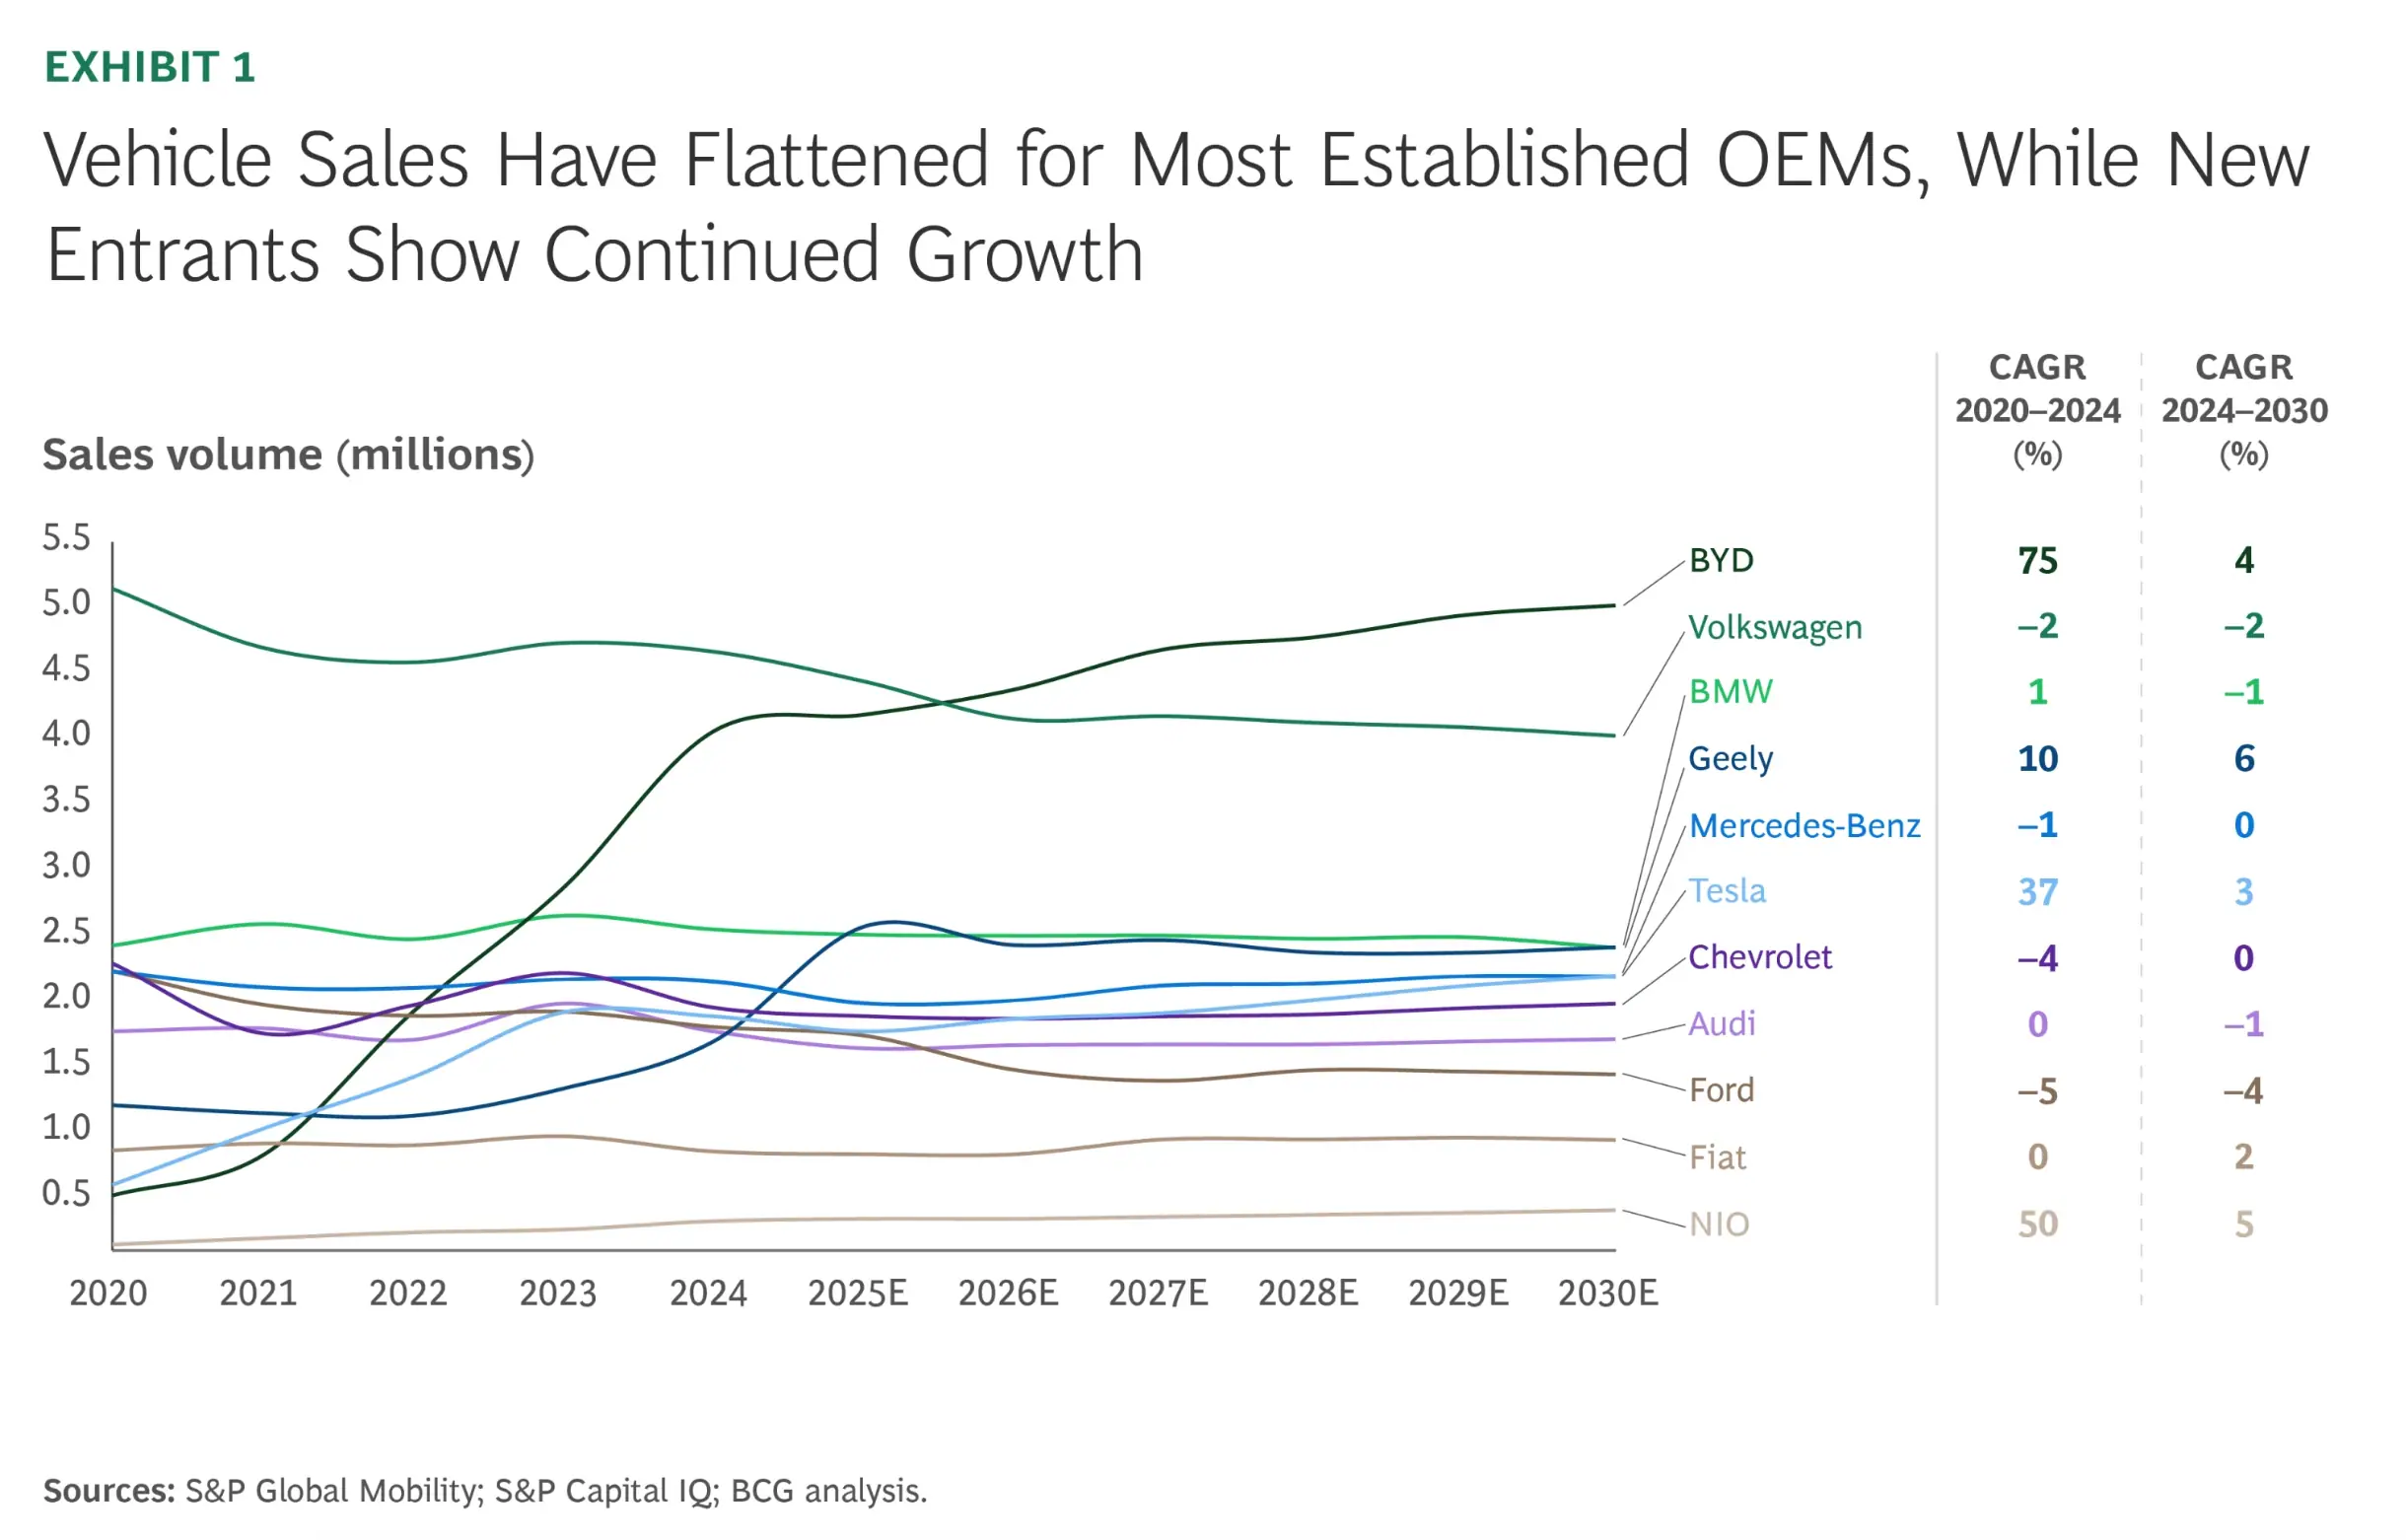
Source: BCG
Looking at these figures, what is the takeaway? The story this chart tells is that the storm is over. It suggests that after a few years of violent competitive disruption, the market has suddenly reached a gentleman's equilibrium. Smooth sailing from here on out. No rapid changes to anyone. Everyone relax. Time for a spa day — cucumber water all around.
This chart was published in early September 2025, and there was a gap between when the dataset was provided by S&P and the final publishing data, I would guess that this chart reflects the version from maybe June 2025 if not earlier than that. Now we are in December, and extrapolating the figures from the first eleven months would indicate that BYD's sales will end with around 4.6 - 4.7 million units. A figure that the chart indicates BYD should reach no sooner than 2027.
BCG continues to produce charts based on their own models that imply they know exactly where the market will go. They keep making the same mistake (one that, to be fair, I used to make too): assuming the variables remain constant.
Let's look at another example below—a chart showing steady, gradual growth in BEV adoption in Europe.
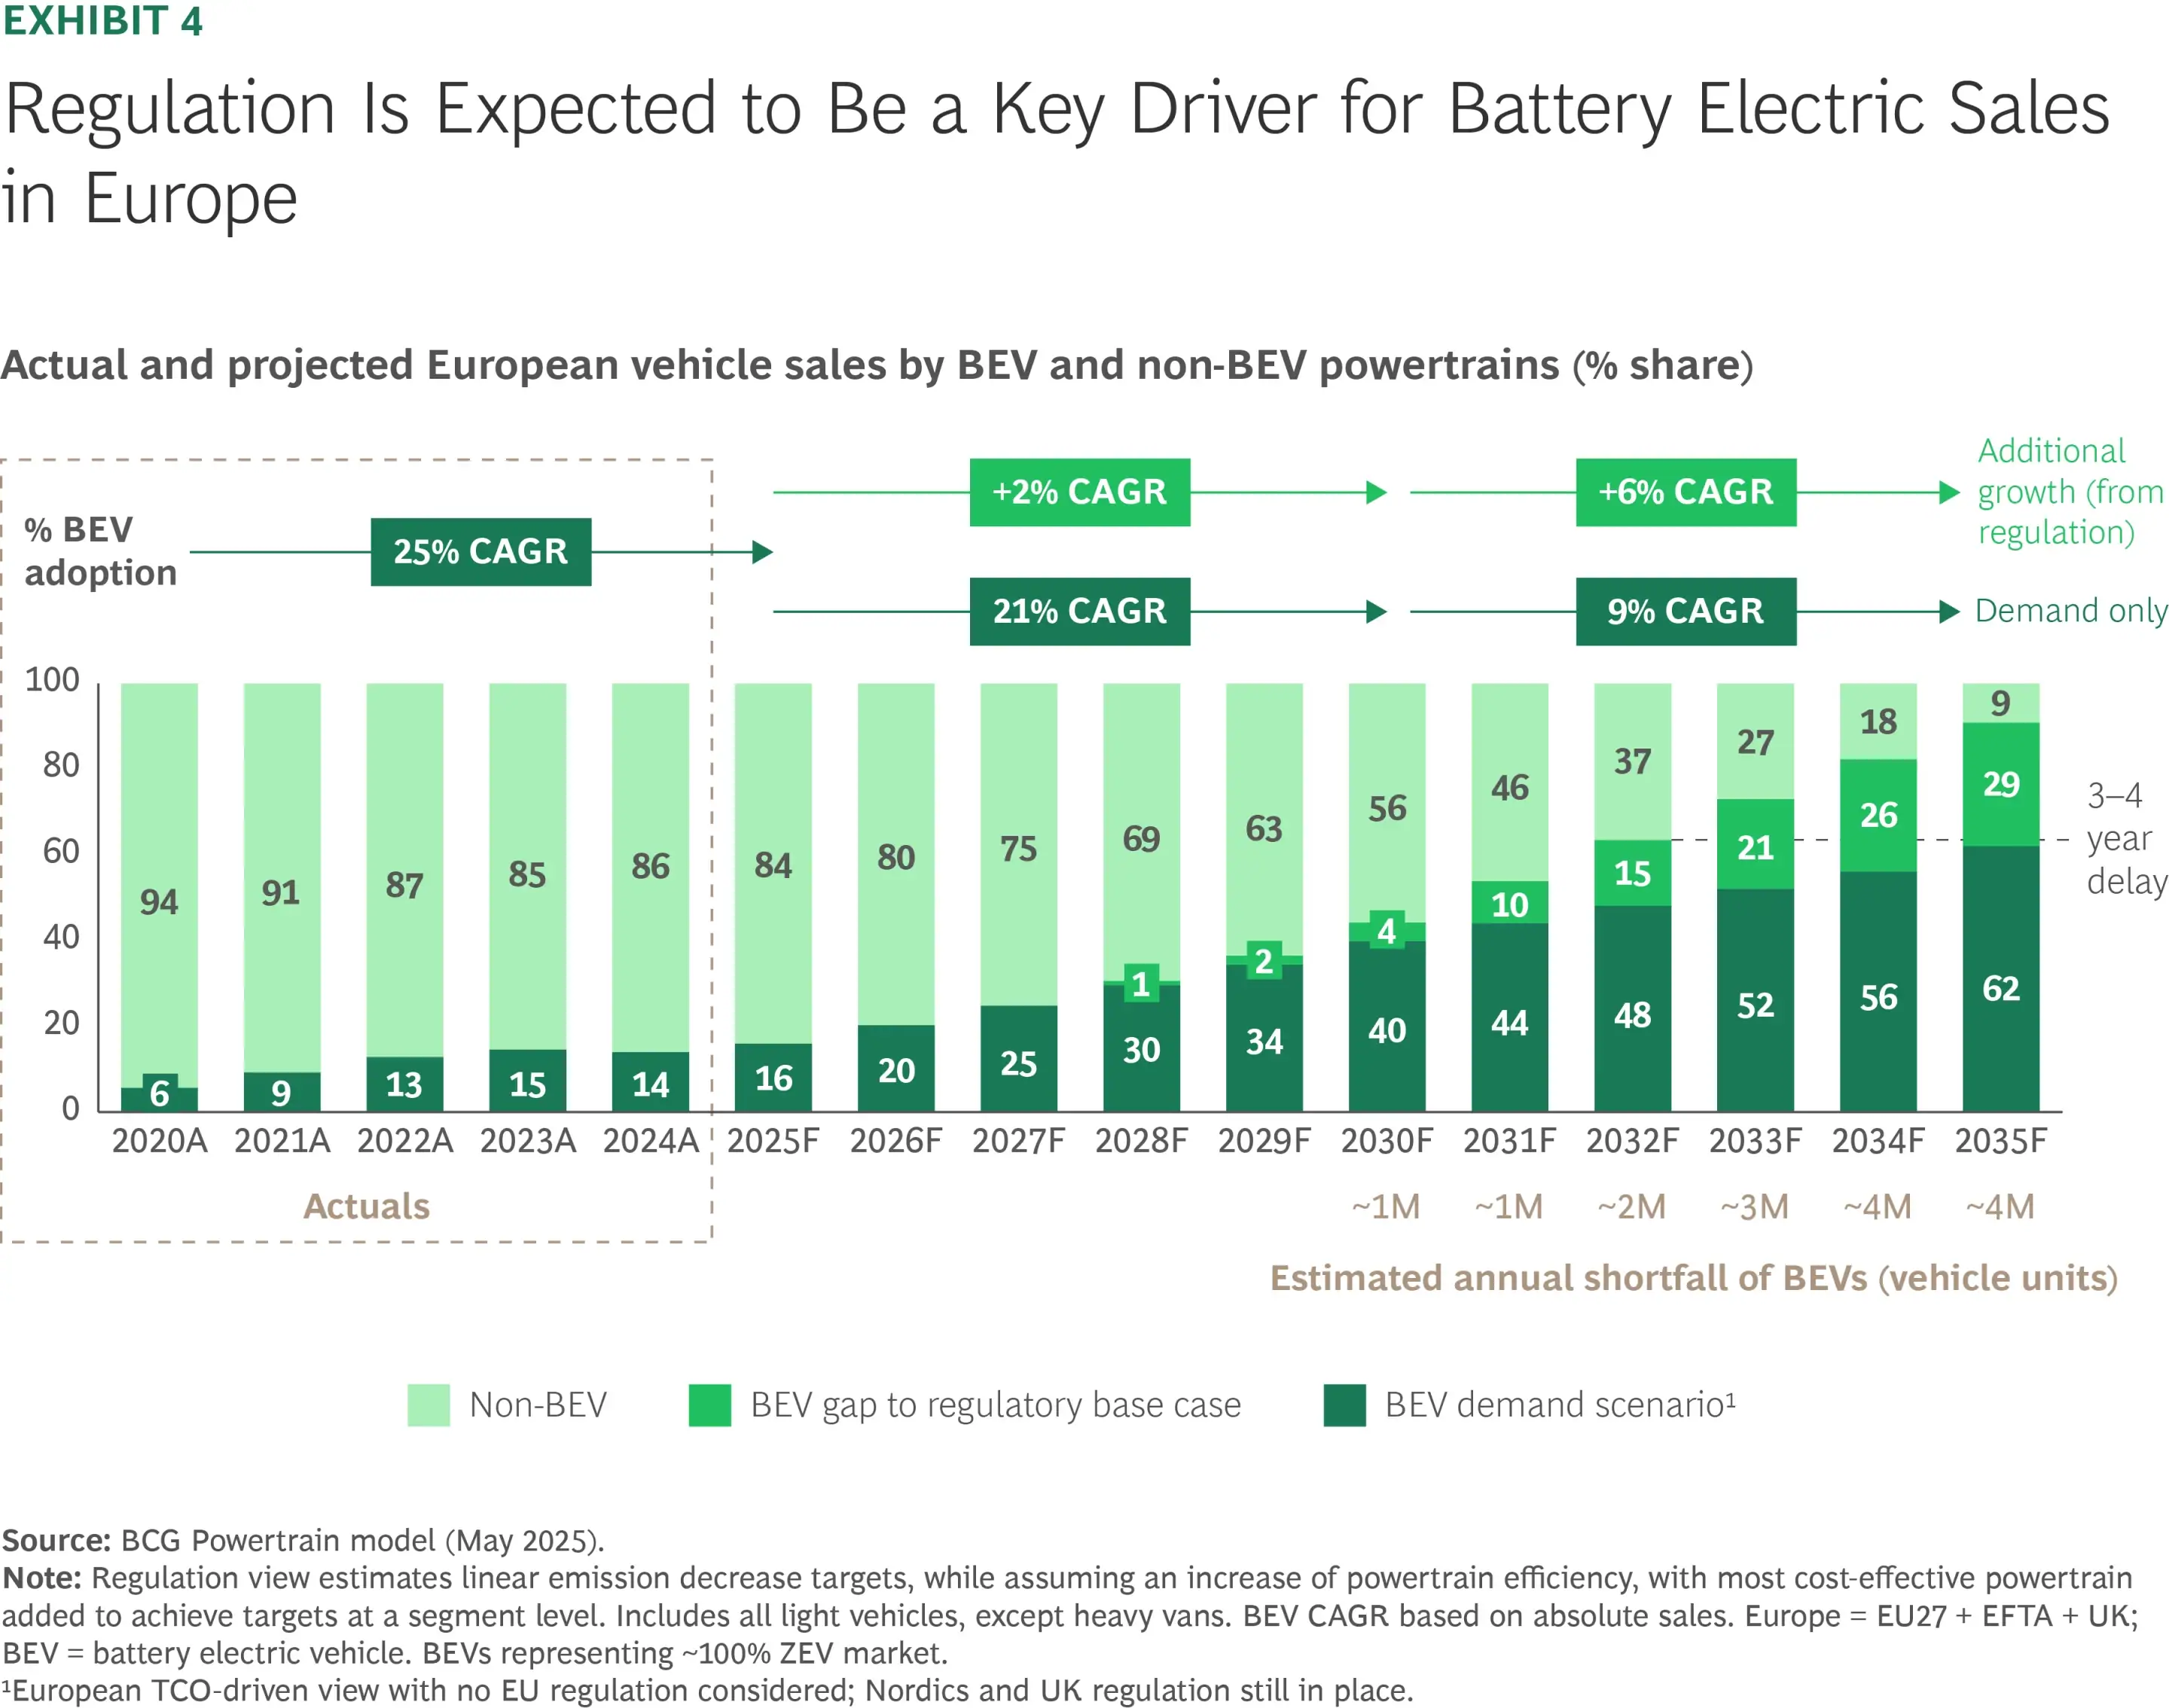
Source: BCG
The chart shows the BEV penetration growing from 14% in 2024 to 62% in 2035. This surely assumes today's technology evolves linearly. But what if there is another breakthrough?
What if solid-state batteries achieve commercial scale five years early? What if a new manufacturing technique cuts costs by another 30%?
If a breakthrough happens, the "smooth sailing" forecast evaporates. Suddenly, the currently "radical" vision of 100% BEV penetration in Europe by 2035 shifts from "unlikely" to "very likely."
Jedi Mind Tricks
If a car was reliable as these forecasts, it would be recalled, and the brand would get destroyed by buyers. Yet, the consultancy-industrial complex continues producing forecasts, using more or less the same broken methodologies based on linear thinking, as if the benefits were outweighing any negatives from getting things really wrong. What could explain this paradox?
1. Forecasts aren’t about accuracy — they’re about organizational comfort and coordination
In theory, forecasts exist to predict the future.
In practice, their job is to create the appearance of certainty inside organizations that cannot function without it.
Executives need numbers to:
- justify budgets,
- align teams,
- calm boards,
- and make multi-billion-dollar capital allocation decisions.
A forecast provides a shared anchor — a single story about the future that everyone can plan around. Without such a number, every department in a traditional OEM would operate on its own assumptions, and governing the organization would be impossible. Disruptors, of course, work differently — they rely less on prediction and more on rapid feedback loops, central decision authority, and real-time adaptation.
This explains why clients — traditional OEMs — rarely punish inaccuracy.
The value comes from the illusion of control, not predictive truth.
A tidy chart is often more politically useful than admitting: “We don’t know.”
Simply put, these organizations behave in an inefficient way, but decades of institutional habit and structural inertia create a burden too heavy to shed quickly — even when the environment demands it.
2. Forecasts are products — and the business model rewards their production, not their correctness
For consulting firms and data vendors alike, a forecast is a commercial asset.
A forecast:
- justifies strategy projects,
- fuels thought leadership,
- helps create demand for follow-on consulting work,
- and, for data vendors, is the literal product being sold.
Very few people audit accuracy years later.
No one demands refunds when the market moves 2× or 3× faster than expected - legal disclaimers take care of that.
Every miss can be rationalized (“policy changed,” “technology shifted,” “unexpected volatility”), and then a new forecast is published.
When there is no economic penalty for being wrong, but a significant economic reward for producing the next forecast, the machine keeps running.
3. The flawed methodologies persist because changing them is riskier — and less profitable — than reusing them
Despite repeated failures, most forecasting models still rely on gentle extrapolations of the past or a very limited number of assumptions that don't reflect the real world. Why?
Because revising the methodology would require:
- significant investments,
- internal battles — potentially even dismissals, or in the more optimistic scenario, long explanations to stakeholders who don't have much experience diving into deep methodological trenches,
- and introducing additional uncertainty into what is supposed to look like a tidy, rigorous product.
All this simply to try to be less wrong—without any guarantee of success.
Reusing the old model is far safer.
It maintains continuity and keeps the consulting process efficient.
Meanwhile, the market behaves nothing like the orderly curves in the spreadsheets and charts.
The world changed. The modeling culture didn’t.
And so forecasting by consultants and data vendors endures much like a legacy product drifting toward the abyss — still produced because enough customers want the comfort of something definitive, even as it quietly slips into obsolescence.
A New Hope
So if the maps are wrong and the territory keeps shifting, what is an executive supposed to do?
The instinctive answer is to ask for better maps. But that instinct is precisely the problem.
In unstable markets, forecasts do not reveal the future — they merely freeze today’s assumptions into tomorrow’s commitments. And in non-linear markets — like EV adoption — assumptions collapse fast.
This is where the Star Wars metaphor, hinted at in the section titles, reaches its conclusion.
Luke Skywalker enters The Empire Strike Back with a mental model that has already been validated: courage + training + intent lead to success. It felt right because it worked for him before. But it fails this time because the environment changes — the Empire’s scale and power overwhelm factors that once mattered. Courage and skill still matter — but they are no longer decisive. The model doesn’t bend. It breaks.
Luke was prepared in the narrow sense of skill and effort, but unprepared for the structural realities of the conflict. After that defeat, he does not look for a more precise version of the same equation. Instead, he abandons the belief that success can be inferred from intention and preparation alone, and learns to operate in a world defined by power asymmetries, timing, and uncertainty.
That is the shift most OEMs and suppliers have not made.
They continue to ask questions like:
- When will EV demand normalize once enough early adopters confront real-world trade-offs?
- When will new entrants running unsustainable business models exit or consolidate?
- When does the industry adjust to today’s excess capacity?
These questions assume that the system is converging toward stability. The evidence presented earlier suggests the opposite: the system remains structurally unstable, and each technological or cost breakthrough resets the trajectory.
In such an environment, the relevant strategic question is no longer where the market will be, but how quickly the organization can detect when its assumptions break.
That is a fundamentally different operating model.
It does not eliminate forecasting — it demotes it. Forecasts stop being treated as truth claims about the future and revert to what they actually are: temporary hypotheses, held lightly, and discarded quickly.
The competitive advantage shifts accordingly.
Not to the company with the most elegant 10-year outlook — those have proven worthless — but to the company with:
- the shortest delay between market signal and internal recognition,
- the lowest political cost of admitting that a plan is wrong,
- and the fastest ability to reallocate capital once that admission is made.
Being “right” about 2035 has turned out to be commercially irrelevant.
Being early by a quarter when reality diverges from the plan is not.
Ten years ago, Sergio Marchionne — then CEO of Fiat Chrysler Automobiles — closed Confessions of a Capital Junkie with a passage from Through the Looking-Glass (1871) by Lewis Carroll:
“Now here, you see, it takes all the running you can do, to keep in the same place. If you want to get somewhere else, you must run at least twice as fast as that.”
The automotive industry increasingly resembles that world, where standing still is indistinguishable from falling behind.